
What is demand forecasting? Methods, examples and accuracy
Demand forecasting is predicting how much of a product will sell in a given period and channel. The main methods, a worked example, how accuracy is measured and what AI changes.
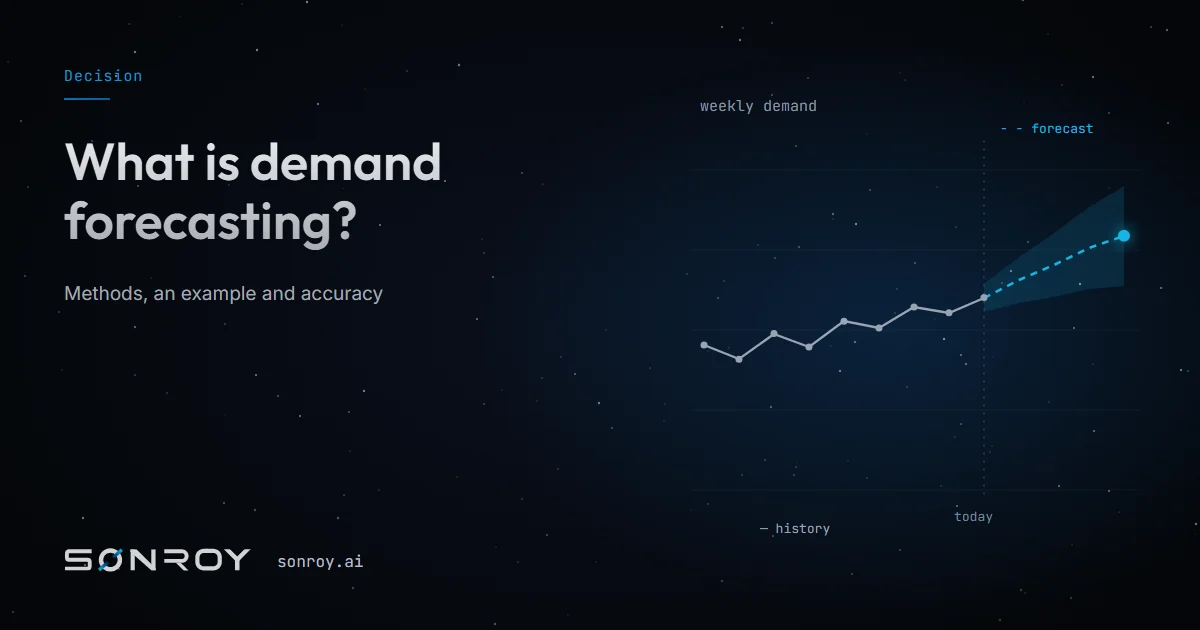
Demand forecasting is predicting how much of a product will sell in a given period and channel, using past data and known drivers. Ordering, production, stock, campaign and budget decisions all rest on this one number; demand forecasting is therefore not a reporting task but a decision input.
Why does demand forecasting matter?
If the forecast is too high, you get excess stock: product sitting in the warehouse, cash tied up and deep markdowns at the end of the season. If it is too low, you lose sales: sold-out sizes, empty shelves, customers going to a competitor. Both errors cost money, but they are booked in different places. Excess stock shows up in finance, lost sales show up in sales. A good forecast lets you set the balance between those two costs deliberately.
What types of demand forecast are there?
Forecasts differ on two axes. The first is the horizon: short term (weekly replenishment, store transfers), medium term (season plan, production orders) and long term (capacity, new stores, new categories). The second is the level: single product, product group, category, channel or store. The longer the horizon, the higher the level; a weekly reorder needs product and size, a season plan needs category and product group.
What are the methods of demand forecasting?
Methods fall roughly into three families: qualitative methods based on expert judgement, time-series methods that read the pattern in past sales, and causal methods that explain sales through drivers such as price and promotions. Machine learning draws on all three.
| Method | How it works | When it fits |
|---|---|---|
| Expert judgement, Delphi | Combines the estimates of sales, product and planning teams | New products or categories with no history |
| Moving average | Uses the average of the last few periods for the next one | Stable products with weak seasonality |
| Exponential smoothing, Holt-Winters | Weights recent periods more; trend and seasonality can be added | Seasonal and trending products |
| ARIMA | Models the series' relationship with its own past | Series with a long, regular history |
| Regression (causal) | Explains sales through price, promotions, weather and similar drivers | When you want to measure a driver's effect |
| Machine learning | Learns many signals and similar products together | Many products, many channels, short lifecycles |
The trend-and-seasonality version of exponential smoothing goes back to Holt's work in the late 1950s and Winters' in 1960; the ARIMA approach goes back to Box and Jenkins' 1970 book. For a detailed, free treatment of the methods, Hyndman and Athanasopoulos' Forecasting: Principles and Practice is a good place to start.
A demand forecasting example: a knitwear category
Say women's knitwear sold 400, 420, 380 and 440 units over the last four weeks (illustrative figures). A four-week moving average forecasts 410 units for next week. But the calendar shows the first cold week, and last year the category jumped sharply in the same week. The moving average cannot see that; an exponential smoothing model with seasonality can. If a promotion is also planned for that week, you need a causal model that accounts for the promotion's effect separately.
The example shows one thing: the right method depends on how the product behaves and on the decision's horizon. Applying one method to the whole catalog means systematic error in part of it.
How is forecast accuracy measured?
The most common measure is MAPE: the average of the gap between forecast and actual, as a share of actual. It misleads on low-volume products; on an item selling two units, a one-unit miss looks like a fifty per cent error. That is why retail more often uses volume-weighted WMAPE. The third measure is bias: is the forecast consistently high or consistently low? A consistently high forecast produces excess stock; a consistently low one produces lost sales.
Accuracy should be measured at the level where the decision is made. If orders are placed at product-group level, size-level error does not directly affect that decision.
How is AI changing demand forecasting?
Three things changed. First, the number of signals: alongside sales history, price, the promotion calendar, returns, weather and search trends can be read in the same model. Second, products without history: the model can forecast a new product from the behaviour of similar ones. Third, self-correction: deviation is tracked and the model is updated with actuals every period.
But the real difference is not in the technique; it is in the use. If a forecast stays a report, nobody acts on it. S0 Forecast combines sales, returns, competitor and season data into one forecast and attaches it to S0 Supply's order proposal, S0 Ecom's catalog plan and S0 Finance's budget. When a forecast becomes a decision and its outcome is measured, it becomes part of the decision intelligence loop. We walk through how this is set up in fashion retail in AI demand forecasting.
Where should you start with demand forecasting?
Pick one category and one decision: for example, the weekly reorder. Measure today's forecast accuracy with WMAPE and bias; you cannot improve what you do not measure. Then attach the forecast directly to that decision and write the outcome back. To see this flow on your own data, book a demo.
Short answers
Not quite. A sales forecast predicts the sales that will happen; a demand forecast predicts how much customers would want to buy. When stock runs out, sales fall but demand does not, so a forecast built without correcting out-of-stock weeks understates demand.
There is no single best method. Simple methods are enough for stable products; exponential smoothing suits seasonal products, and machine learning stands out for large, short-lifecycle catalogs. The choice depends on how the product behaves and on the decision's horizon.
At least two seasons of data is a typical starting point for seeing seasonality. For new products with no history, the behaviour of similar products is used instead of the product's own past.
For a few products and simple methods, yes. As the number of products, sizes, channels and signals grows, a manually updated spreadsheet both slows down and makes it hard to track deviation.
Summary
- Demand forecasting predicts a product's sales in a given period and channel and feeds order, stock and budget decisions.
- Methods fall into qualitative, time-series and causal families; machine learning draws on all three.
- Accuracy is measured with WMAPE and bias, at the level where the decision is made.
- A forecast only creates value when it is attached to a decision and its outcome is measured.
Related
No decision from zero: why company memory is AI's real job
Data collection is solved; deciding is not. Why companies still decide with what one person remembers, where the cost of memoryless decisions gets booked, and how one living memory changes it.
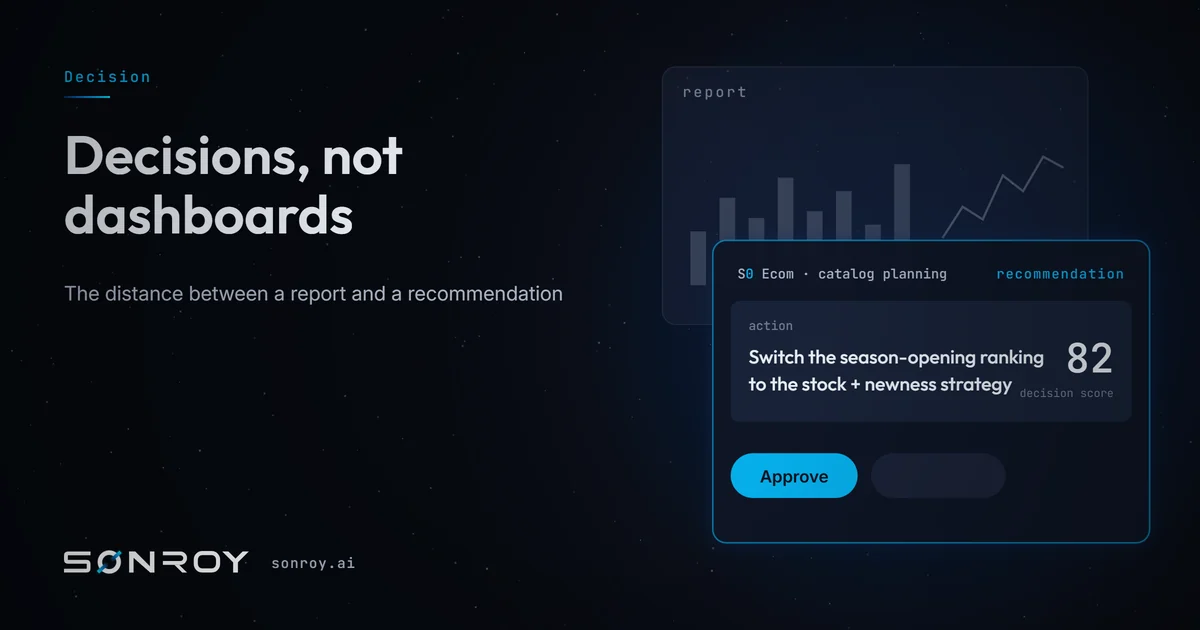
Decisions, not dashboards: the distance between a report and a recommendation
You do not measure the screen people look at; you measure the return of the decision they make. The difference between a report and a recommendation, what the approval triggers, and how it changes the management meeting.
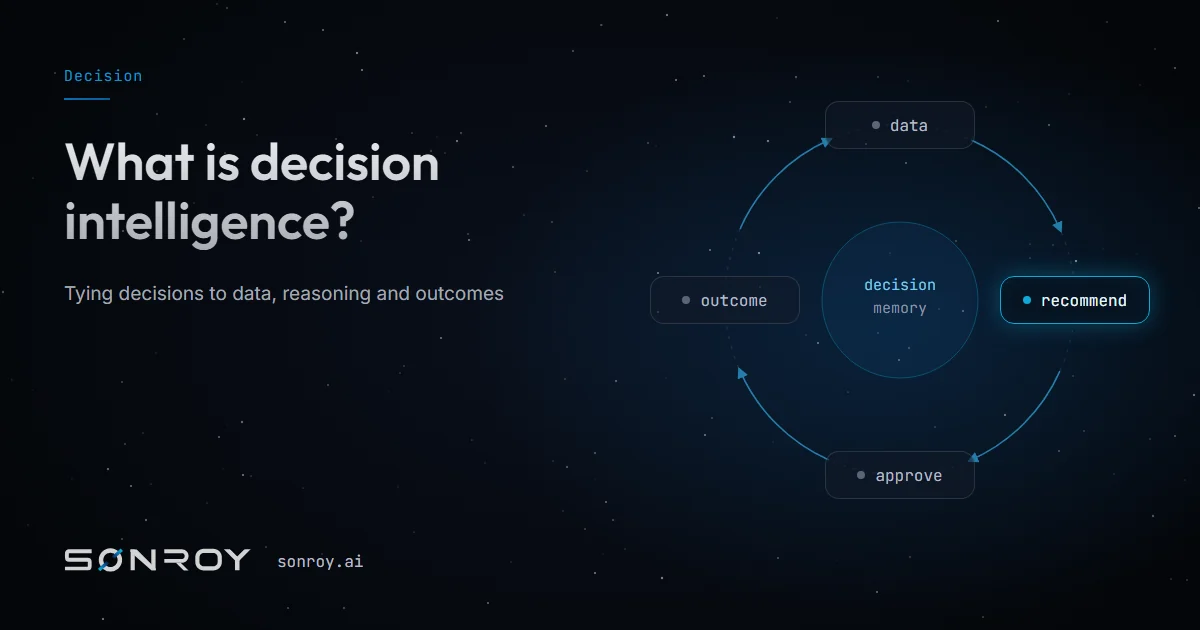
What is decision intelligence? A guide from data to decision
Decision intelligence is the discipline of engineering how decisions are made and learning from their outcomes. How it differs from BI, how it works in retail and where to start.